There have been marked differences for how the population of different countries respond to the Covid pandemic, perhaps best exemplified in the BA.5 variant wave. As you can see in the Figure below, deaths have been higher for BA.5 in Australia and New Zealand than any prior variant, and particularly Omicron BA.1. That’s a distinctly different pattern from South Africa, where there was little evidence of increased fatality for BA.4/5 or the United States where the increase was small. Why are there such striking differences for the effect of BA.5 between countries?

The “immunity wall” of a population is an aggregate of many factors that include demographics such as age and comorbidities, like obesity or diabetes. Age is especially important given immunosenescence, the less potent immune response generally mounted with advanced age. For the pandemic, of particular note, it includes prior infections, vaccines, boosters, combined infections and boosters (hybrid immunity) and waning of the immunity from vaccines or infections over time. There are also other factors that come into play providing intrinsic protection (without exposure) vs Covid, with several genomic loci associated with protection, pre-existing T-cells from skin and gut microbiome exposure, and, in some people, preexisting immunity build from common cold coronavirus exposure. We have no evidence that these intrinsic factors differ between populations and they likely account, in aggregate, for a very small proportion of people.
With that background, let’s probe deeper into why the patterns are so different between New Zealand, Australia vs South Africa, US, and many other countries. There was a marked difference in the incidence of prior infections in Australia and New Zealand that was an outgrowth of their zero-covid policy that has served them well to protect vs. hospitalizations, deaths, and Long Covid on a cumulative basis. These countries have had excellent vaccine uptake, but had vulnerability to BA.1 and, despite that major outbreak, subsequently BA.5. Clearly the vaccine and booster rates for these countries do not explain the differences, since South Africa was distinctly lower than Australia and New Zealand, with the United States in between.
Prior infections do clearly play a pivotal role to explain the differences. As we are seeing in Japan currently, where like Australia and New Zealand, there was marked containment of the virus throughout the pandemic until Omicron BA.1 led to a major surge, superseded by a much bigger one with BA.5. The deaths there are still on a sharp rise.
No question that population exposure to infections plays a key role, as the people infected with SARS-CoV-2 see the whole virus, not just the spike (as the vaccines provide), and those who also get vaccinated have a potent form of hybrid immunity documented in so many studies. But there is a major price to pay to have these infections, with some fatalities, hospitalizations and people affected with Long Covid.
I would like to point out this it isn’t just about prior infections—it is the variant type of infections, too, that appears to be part of the explanation. Sure there are marked differences in age demographics for South Africa and the other countries in this comparison. But also the exposure to the Beta variant was especially severe in South Africa, and distinct in this country, as seen in the Figure below mapping the evolution of the virus in the 4 countries.
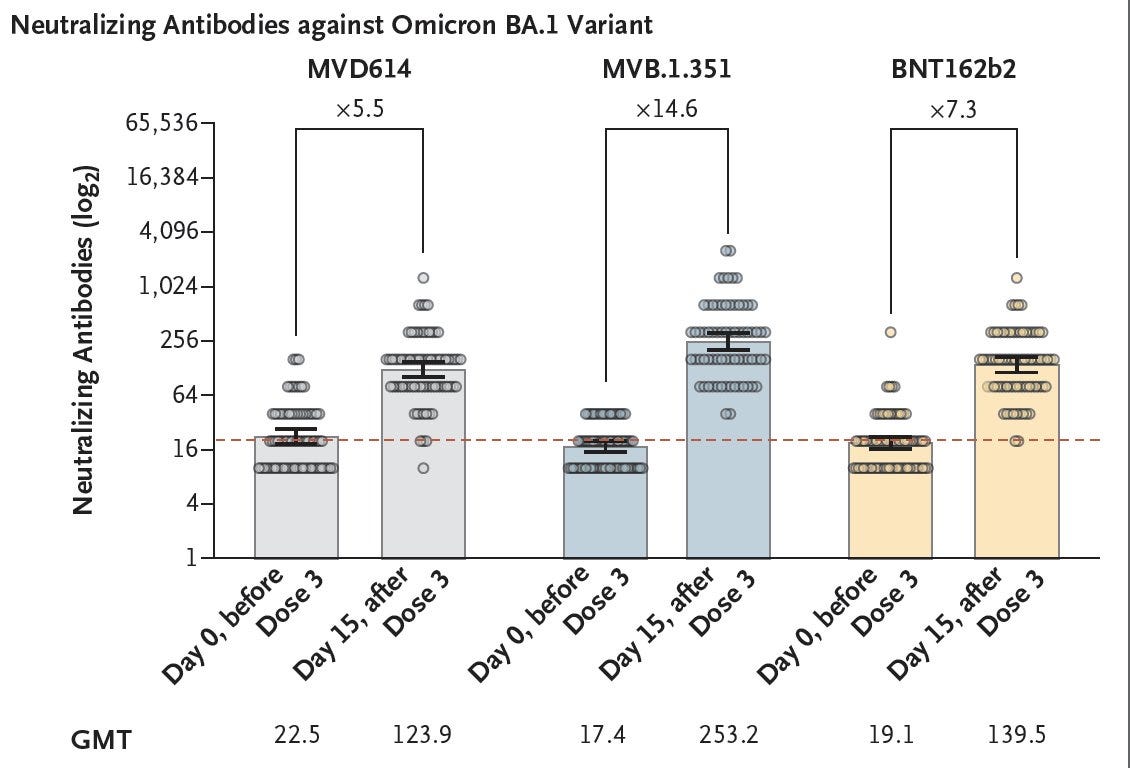
Why is this Beta exposure noteworthy? Until Omicron appeared, the Beta variant was characterized as having the most immune escape of any variant. While Beta doesn’t share many mutations with BA.5, a vaccine directed to Beta has cross-immunity to Omicron that was significantly greater, a 2-fold increase in neutralizing antibodies, than the ancestral Pfizer/BioNTech (BNT162b) vaccine. The major Beta wave in South Africa may have helped provide cross-immunity to Omicron and its sublineages.
A similar story may help explain the United States handling BA.5 better than may have been predicted from countries in Europe (such as Portugal, Greece, France, UK, Denmark, and others). It uniquely had a major wave of the BA.2.12.1 variant which shares a key spike mutation with BA.4/5 in L452 (Q instead of R) that is not seen in BA.1 or BA.2. The L452 mutation is one that was tied to the biologic properties of Delta, which included its higher pathogenicity. Like the Beta variant mass exposure in South Africa, BA.2.12.1 likely provided some cross-immunity for the subsequent BA.5 wave in the United States.
To summarize, the impact of BA.5 that I have described as the worst variant of the pandemic by its biologic properties is seen clinically where there are less intact immunity walls, mostly as a function of prior infections and the type (main variant underpinning) of infections. Our immunity wall in the United States has helped provide a lesser hit of BA.5, now starting to show a plateau of hospitalizations at a level below that of other countries in Europe, even though our vaccination and booster rate in the US is substantially lower than these countries. Both Denmark and Portugal have presented their data showing BA.5 led to an increased adjusted risk of hospitalizations compared with BA.2, and we await analyses from other countries to verify BA.5’s higher level of virulence compared with earlier Omicron subvariants.
It is important to consider the immunity wall for each population to understand the impact of the virus and its evolutionary arc. The very same variant that is seen as “mild” in one county can be quite “severe” in another. Many factors contribute to the variable perception of the pathogenicity of a specific variant. Keep the immunity wall of a population in mind when you try to interpret the data.


