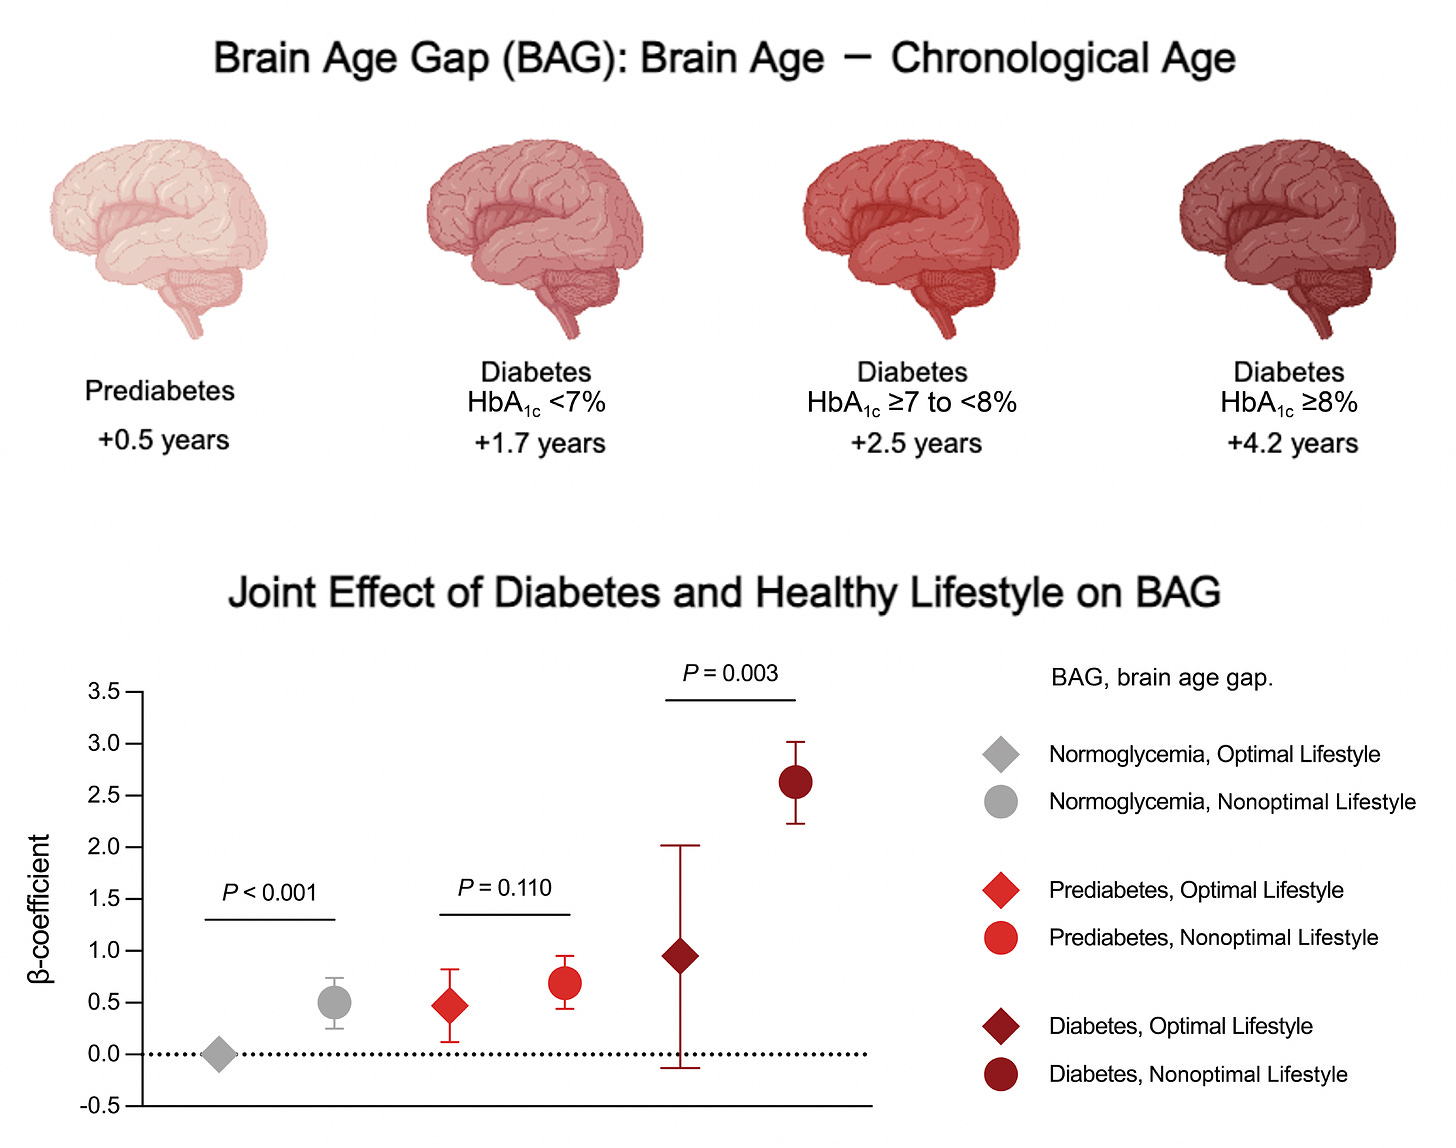
Using high-throughput plasma proteins in large cohorts with extended follow-up, 3 recent organ clock studies that I reviewed highlighted the marked inter-individual and inter-organ variability of the pace of brain aging, its association with mortality, and multiple potential modifiable factors. In recent weeks a cluster of studies have added to our understanding of human brain aging and how it may be influenced. I’ll briefly review the way brain aging is being measured and then get into ways it may be slowed. A recent example below is the impact of HbA1C, an index of glucose regulation, that I’ll get into subsequently.
Measuring Brain Aging
Besides the 3 plasma proteomic studies that tracked the brain clock along with 6 to 10 other organ-specific aging processed, the main way brain aging has been quantified is through imaging.
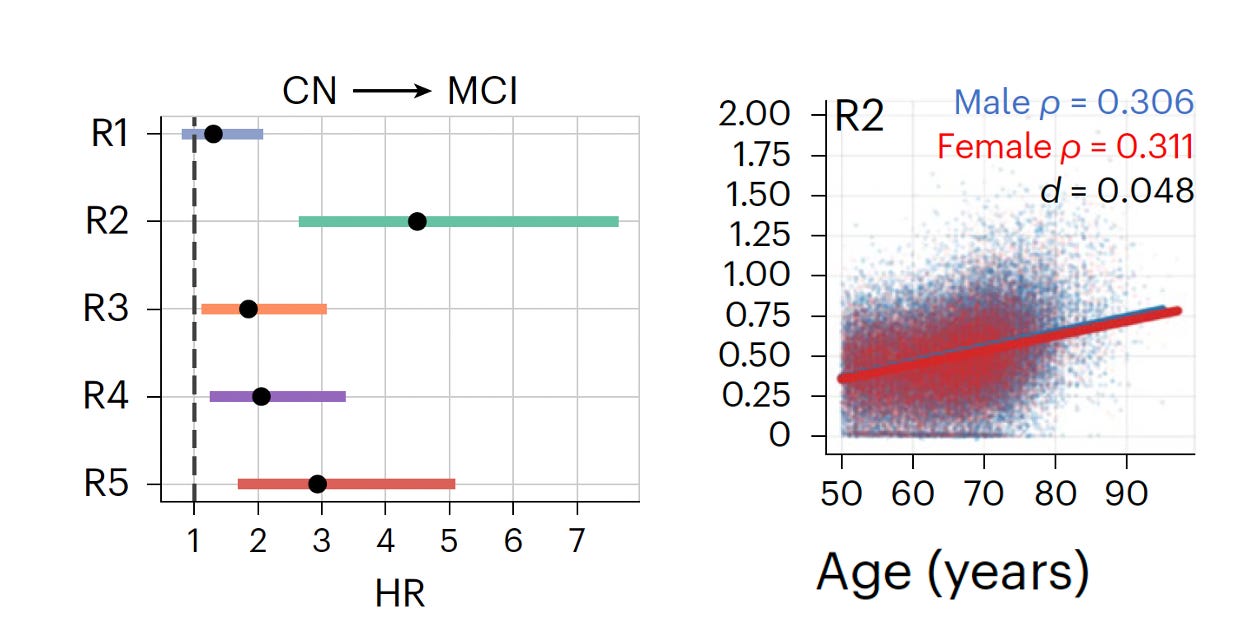
it took about 8 years for Christos Davatzikos and colleagues to complete and publish a study of nearly 50,000 participants with brain MRIs. This involved training a deep learning A.I. model (called Surreal-GAN) from healthy people (N=1,150, aged 20-49 years) and nearly 9,000 older adults. Then this model was applied to a diverse, large multi-cohort population (from 11 studies) and 5 discrete (R) patterns of brain atrophy emerged as shown below, with 3 of them (R2,3 and 5) associated with increased risk of dementia once mild cognitive impairment (MCI) was manifest.
R2, Focal medial medial temporal lobe atrophy (MTL), was the one pattern most strongly associated with deterioration (hazard ratio, HR of 4.5X) from cognitively normal (CN) to MCI. In contrast to other patterns, this one was not affected by sex (right panel below) There was extensive assessment of correlation with genetic, lifestyle, protein marker, environmental, and medical history data.
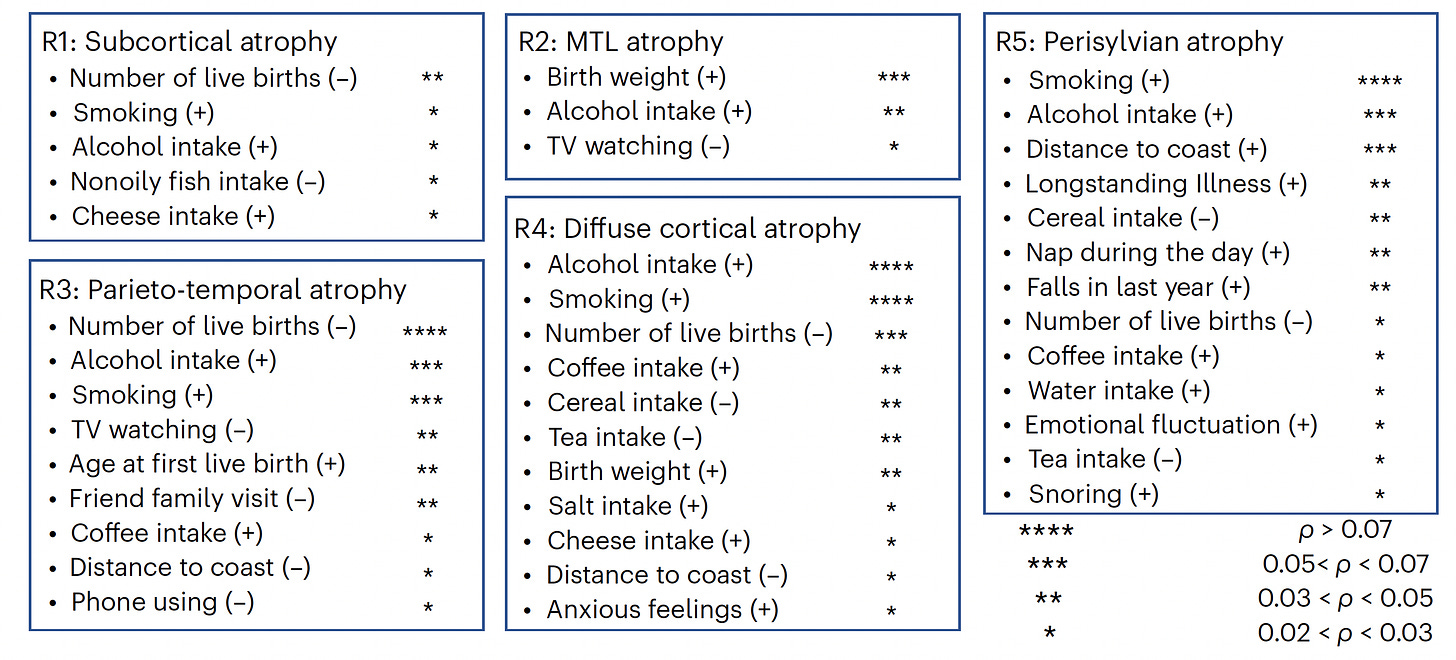
The lifestyle factors associated with the different patterns are shown below, with R2, and 3 being the ones most linked to Alzheimer’s disease. Notably alcohol intake shows up for all 5 patterns.
In another important study of brain imaging using fMRI or EEGs in over 5,300 participants from 15 countries, and A.I. analytics, the main predictors of brain-age gap (imaging vs. chronological age) were air pollution, socioeconomic inequality/health disparities, comorbidities, and “that being from Latin-American countries is associated with accelerated aging.”
A few years ago, David Jones and I spotlighted the work that he and his colleagues at Mayo Clinic have done on paired imaging (MRI + PET) for measuring brain aging.
Let’s switch from imaging to cells. Using brain tissue from 437 older adults, and single-cell RNA sequencing of 1.65 million cells, 2 distinct patterns of brain aging and association with Alzheimer’s disease (prAD) or alternative brain aging (ABA) were identified. While the Alzheimer’s pattern showed an increasing amyloid and tau burden, the ABA had a low and constant burden (Figure below) . Specific types of microglia (i.e.Mic.13) were linked with higher rate of cognitive decline, Tau burden and APOE4 genotype.
Modulating the Pace of Brain Aging
The multiplicity of factors that are associated with slowing of brain aging cut across genetics, lifestyle, environmental domains. In my prior summary of organ clocks, many lifestyle factors (such as smoking and alcohol), specific food intake, and hormone replacement were noted and I won’t repeat that now. Here I’ll add a few new studies to the mix.
Exercise
A new report identified the relationship of cardiorespiratory fitness and brain aging. MRIs and maximum rate of oxygen consumption (VO2 max) were assessed in 125 participants, showing a correlation of greater cerebral myelination with higher VO2 max. Results for one of the models describing the relationship is seen below, MWF -myelin water fraction, an index of myelination). This adds to the beneficial evidence of exercise (as reviewed in my Ground Truths podcast with Euan Ashley) for brain health, highlighting maintenance of white matter.
Glucose Regulation and Lifestyle
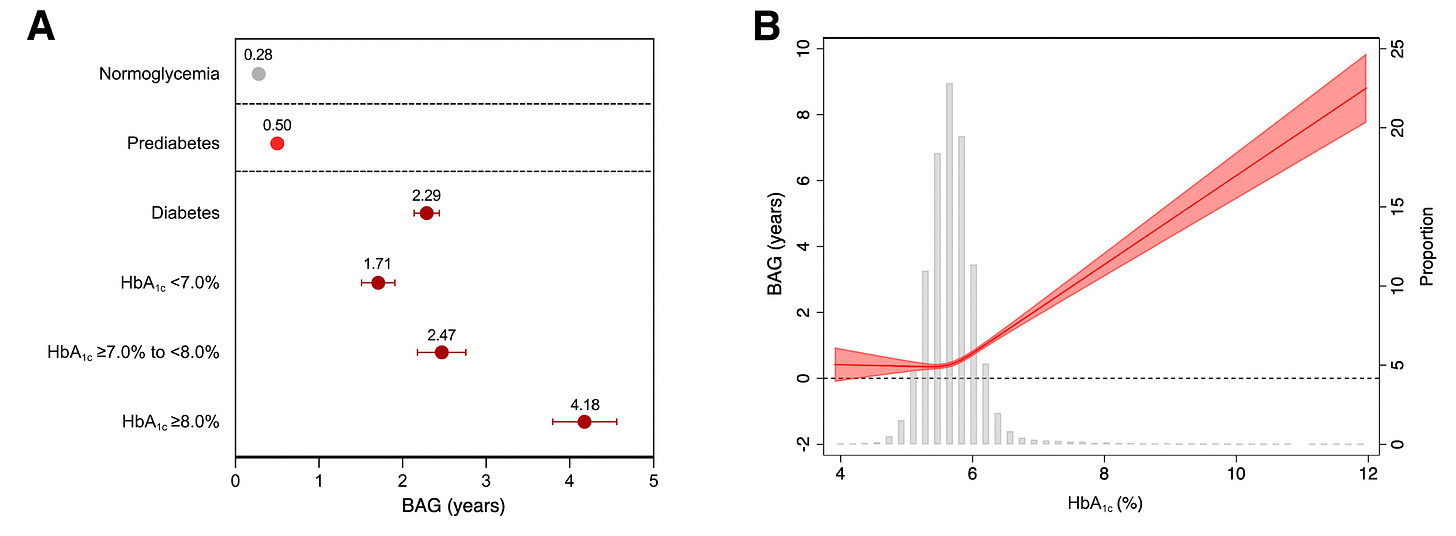
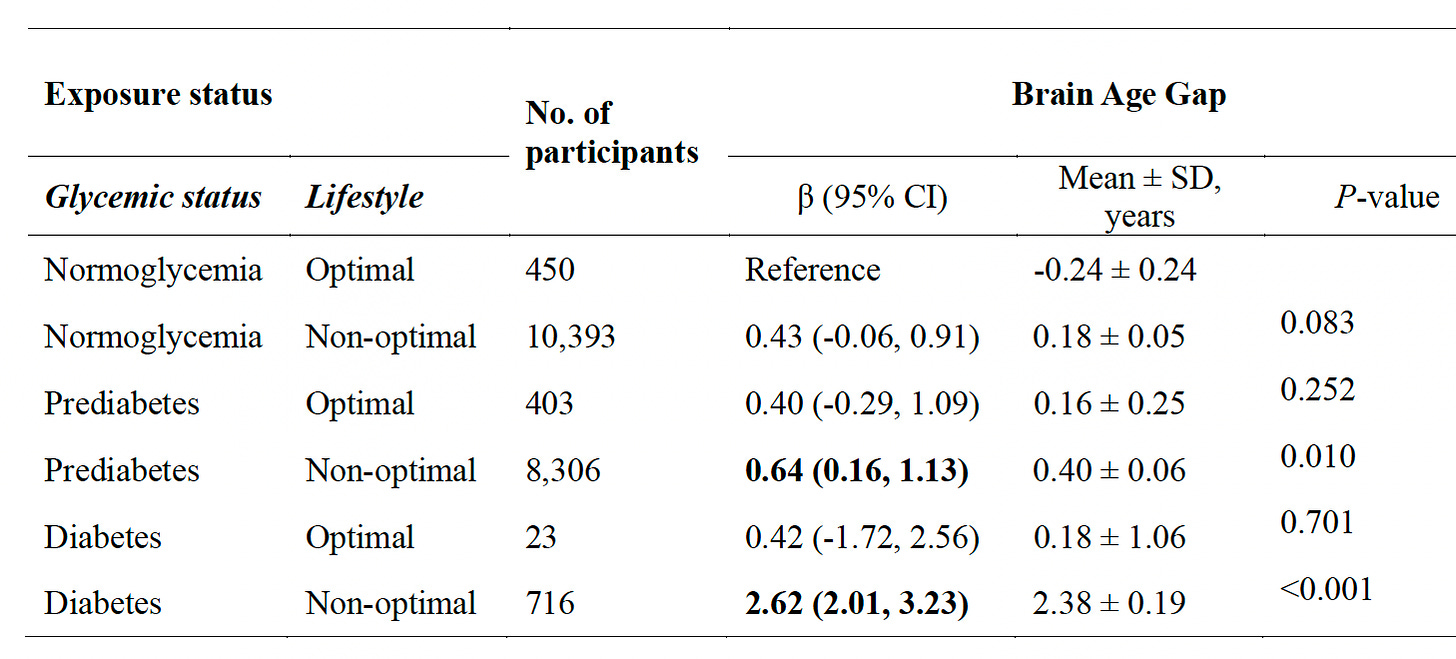
Back to the new study I mentioned at the top of this post, based on over 31,000 participants (aged 40-70 years) from the UK Biobank with extended follow-up. The brain age MRI model was trained and validated in a cohort of 4,355 participants. For brain age gap ,their glycemic status was correlated with the main cardiometabolic risk factors (LDL cholesterol, obesity, hypertension, HDL, triglycerides), and lifestyle factors (smoking, alcohol, and exercise). As seen in the graphic at the top of this post and the one below, there was an association between brain age gap even for pre-diabetes (compared with normal glycemic, low HbA1c). Further,
in all 3 groups (normoglycemia, pre-diabetes, and diabetes), there was a link with healthy lifestyle, particularly among diabetics, and more seen in men than women. You’ll note in the Table below how few were categorized as being in the optimal lifestyle group.
Another small recent study comparing intermittent fasting and a healthy diet in older adults with MRI showed that both slowed the pace of brain aging.
Chronic Musculoskeletal Inflammation
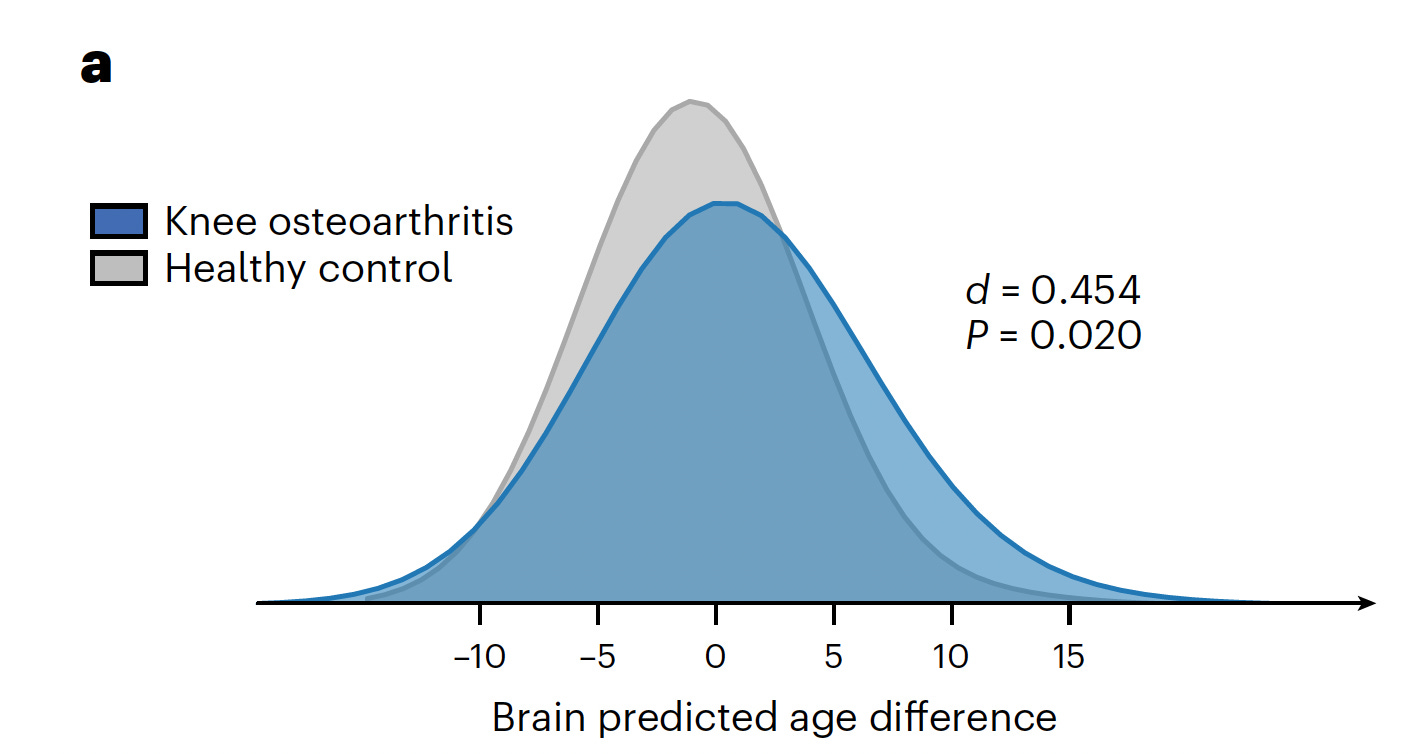
Another recent study of brain aging with MRI and chronic musculoskeletal pain (CMP) found a significant brain age gap among a cohort of patients with knee osteoarthritis, replicated in a second cohort dataset, but not seen with other types of CMP assessed (back, neck, hip). Brain regions affected included the hippocampus, thalamus, and insula; the changes in MRI in people with knee osteoarthritis were also associated with memory decline and dementia during follow-up.
Bottom Line
This recent cluster of brain aging studies have advanced the ways we can quantify the pace of aging, be it with MRI or other brain imaging, or via plasma proteins. Two big enablers are large cohort resources with more than 10-year follow-up, notably the UK Biobank, and A.I. models that are required to extract meaningful outputs. This all comes at a propitious time when there has been a breakthrough—a blood biomarker established for accurately predicting increased risk of Alzheimer’s—p-Tau217. There appears to be multiple ways that the pace of brain aging can be reduced, be it by control of cardiovascular and metabolic risk factors, optimal lifestyle, and perhaps preventing or controlling systemic inflammation. A new project in Scotland has just been announced called NEURii with 1.6 million brain CT and MRI scans matched with electronic health records, which will further our understanding of brain aging and potential modulators. This is an exciting time in neuroscience, deconstructing one of the most important health issues that we face, and hopefully ushering in ways we can keep our brain health intact despite the body-wide aging process.
I hope you found this brief review of recent studies helpful. If you did, please share with your friends and colleagues!
All Ground Truths content—newsletter analyses and podcasts—is free, open-access. Voluntary paid subscriptions all go to support Scripps Research. Many thanks for that—they greatly helped fund our summer internship programs for 2023 and 2024.
Note: you can select preferences to receive emails about newsletters, podcasts, or all I don’t want to bother you with an email for content that you’re not interested in.
Thanks for reading and subscribing to Ground Truths!





Well, this is indeed a fascinating round-up. Thanks so much for doing the deep delving and summarizing the information for us. The study result I found strangest was this: “(CMP) found a significant brain age gap among a cohort of patients with knee osteoarthritis, replicated in a second cohort dataset, but not seen with other types of CMP assessed (back, neck, hip).” One would have thought that CMP of any type would offer an equivalent danger. Did the study shed any light on why knee CMP was a particular culprit?
I find it very interesting that "number of live births" as a factor in BAG appears in 4 of the 5 areas studied.
I also just subscribed due to intense curiosity, and didn't realize until I attempted to comment that I hadn't yet subscribed! Thank you so much for being here on Substack, Dr. Topol!