Your Lab Tests
What Is Being Missed By Relying on Population-Based Reference Values
A Complete Blood Count (CBC) is by far the most frequent lab test obtained, with about 2 million per day or 500 million per year in the United States. All these results are conveyed to clinicians and patients as to being “normal” or “abnormal” indexed to a one-size-fits-all, population-based average reference values.
An important new study this week published in Nature by Brody Foy and colleagues shed new light on the importance of personalized reference values—intra-individual variation— and the multitude of data and insights that can be gleaned from this way if analyzing one’s CBC data. In this edition of Ground Truths, I’m going to review the main results and the implications for how this advances the field of individualized (a.k.a. precision) medicine.
The Study
First let’s get into the meaning of the title: “Haematological setpoints are a stable and patient-specific deep phenotype.” The term setpoint here refers to each person’s values (patient-specific) for 9 indices of the CBC—they are stable over a 20-year period and fluctuate in a narrow range, a low coefficient of variation (CV). That is to say, they are highly regulated. We didn’t know about their long term stability previously, but a cohort of 12,407 healthy individuals from the Mass General Hospital with at least 5 CBCs over 20 years certainly backs up that assertion. The patient-specificity is conveyed clearly by the finding that an individual’s 9 CBC setpoints are different from 98% of all the other healthy adult patients in the cohort. Also known as an “index of individuality.”
You can see in the graph below that inter-individual vacation is far greater than intra-individual variation for each of the CBC metrics, and that long-term (15-year+) variation is similar to short-term at the individual level. On that note, these same researchers had previously shown that even after an acute event such as infection, trauma, or marked inflammation, the CBC setpoint values for that individual return to baseline. There are examples when that isn’t necessarily the case, as seen with the increase in hemoglobin and hematocrit in women after menopause (as presented in the Supplementary material) but overall the stability of the CBC metrics in any given individual over decades is notable. That was also shown to be th case across age, sex, race and ethnicity.
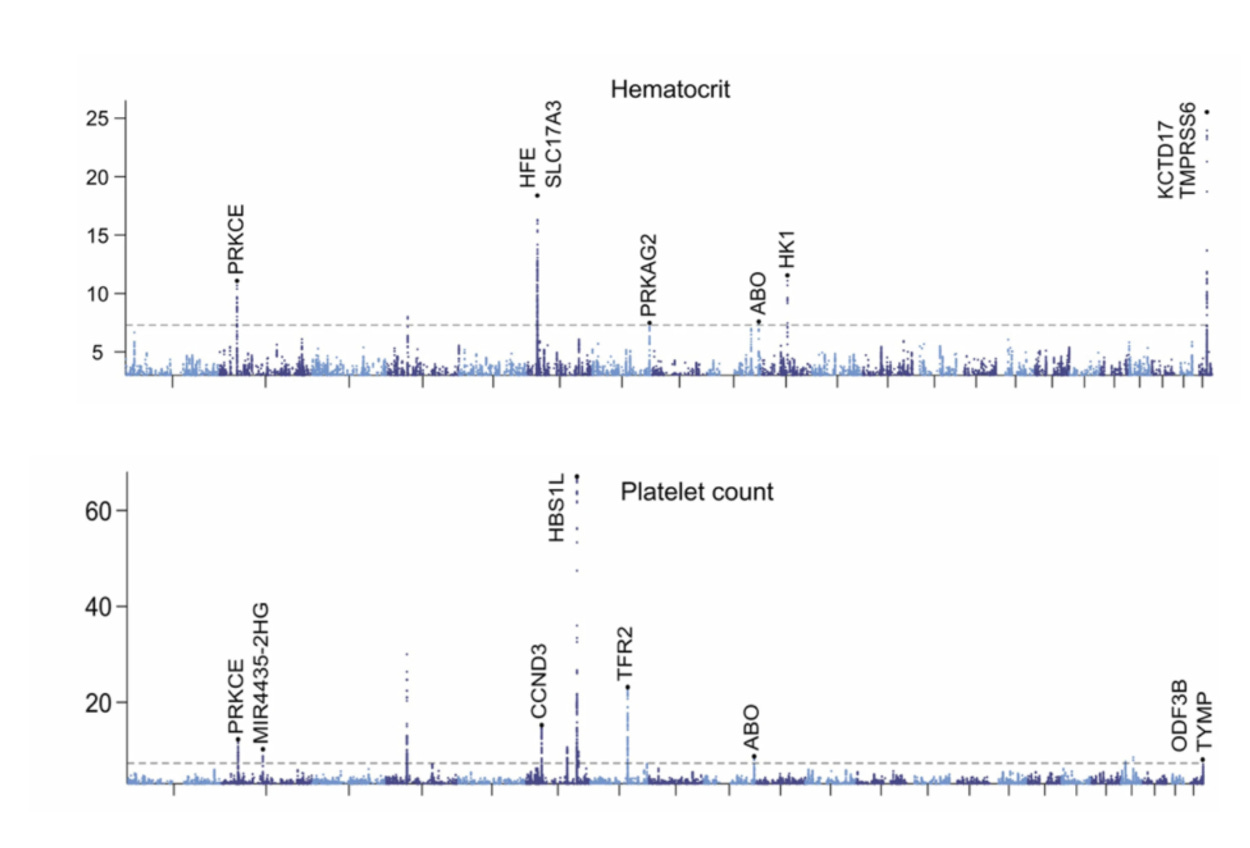
To understand the basis for patient-specific CBC metric setpoints, genome-wide associations studies were performed. As seen below for two results—hematocrit (HCT) and platelets (PLT)— Manhattan plots (dots above the dashed line support genome-wide significance) are representative of the others for demonstrating multiple genomic loci associated with the metrics among first-degree relatives, but this heritability only explained part of why there are such stable setpoints for each individual.
Now let’s get into the key findings of correlation with outcomes.
All-Cause Mortality
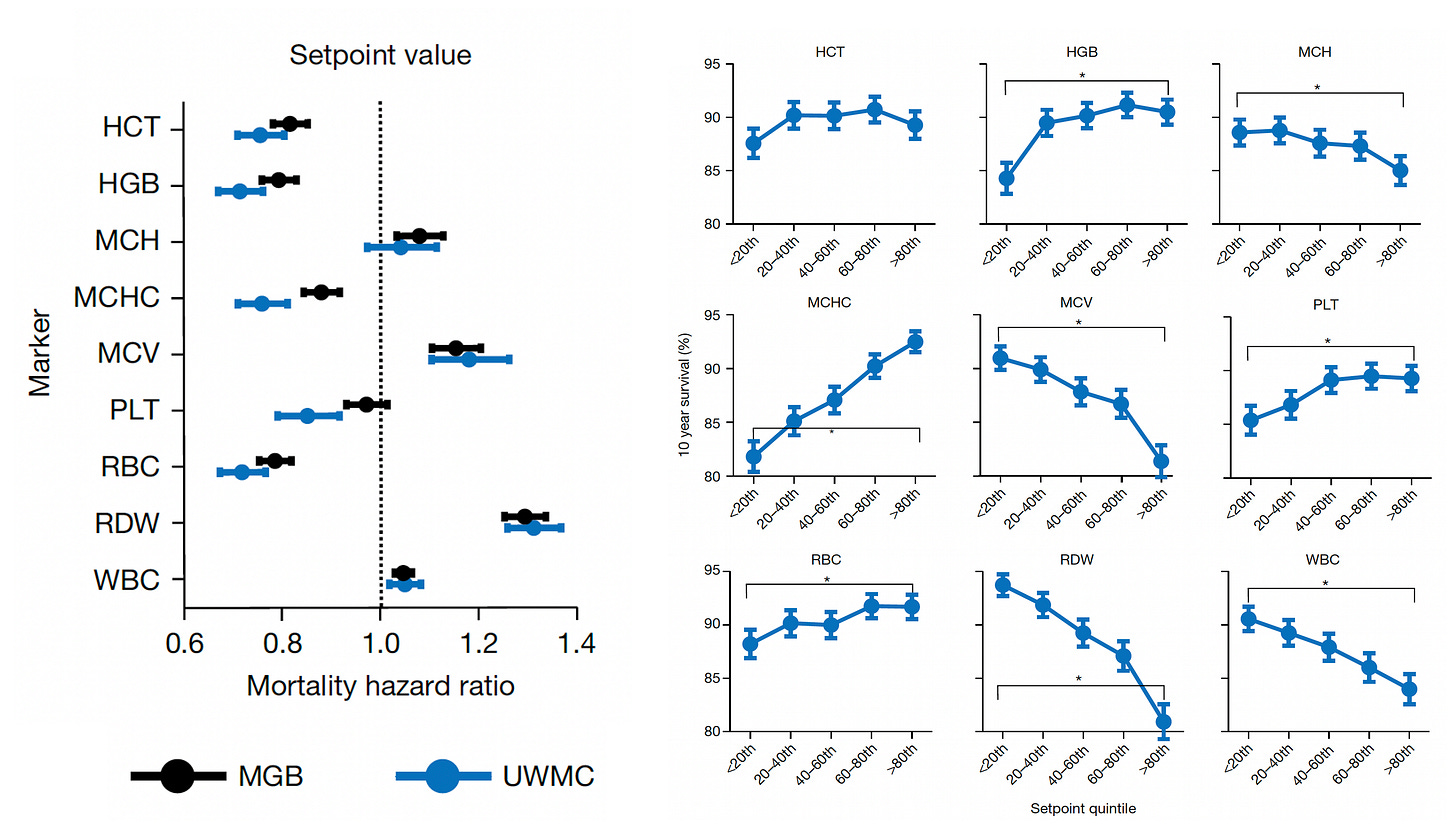
Beyond the 12,407 patients from Mass General Brigham (MGB), data from a second cohort of 13,684 patients from the University of Washington Medical Center (UWMC) were used for validation of risk for all-cause mortality with consistency for most of the 9 setpoints as seen below (left panel). On the right panel below you can see the relationship for 9 different CBC values by quintile for 10-year mortality.
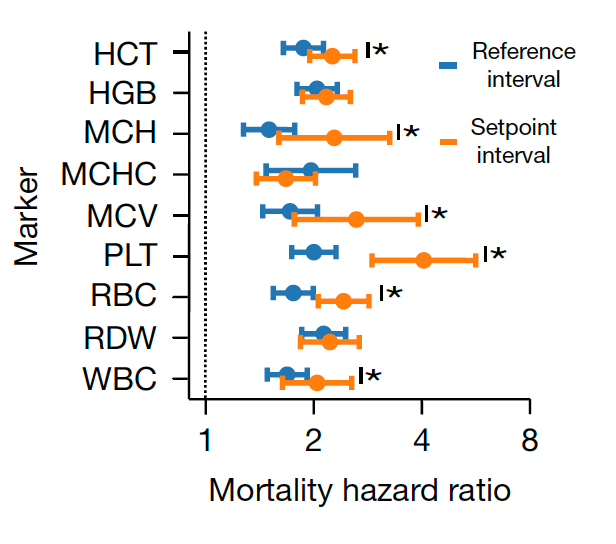
Note how the individual setpoint (orange) is far better than the the population-level reference level (blue) for predicting risk of all-cause mortality.
Importantly, 20% of the cohorts had an increase up to 5% in the chance of dying in the next 10 years, a partitioning which could help us differentiate high-risk status for tighter surveillance and prevention.
Disease Risk
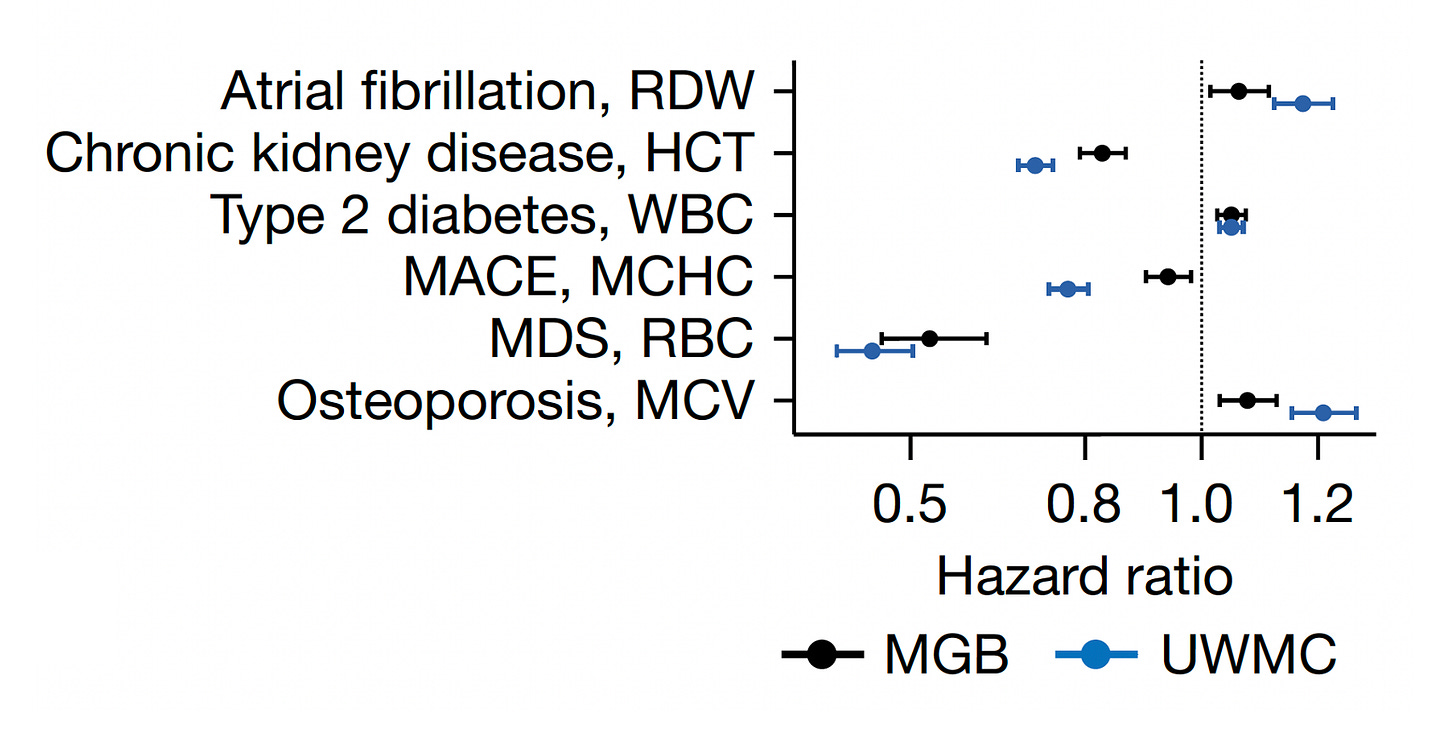
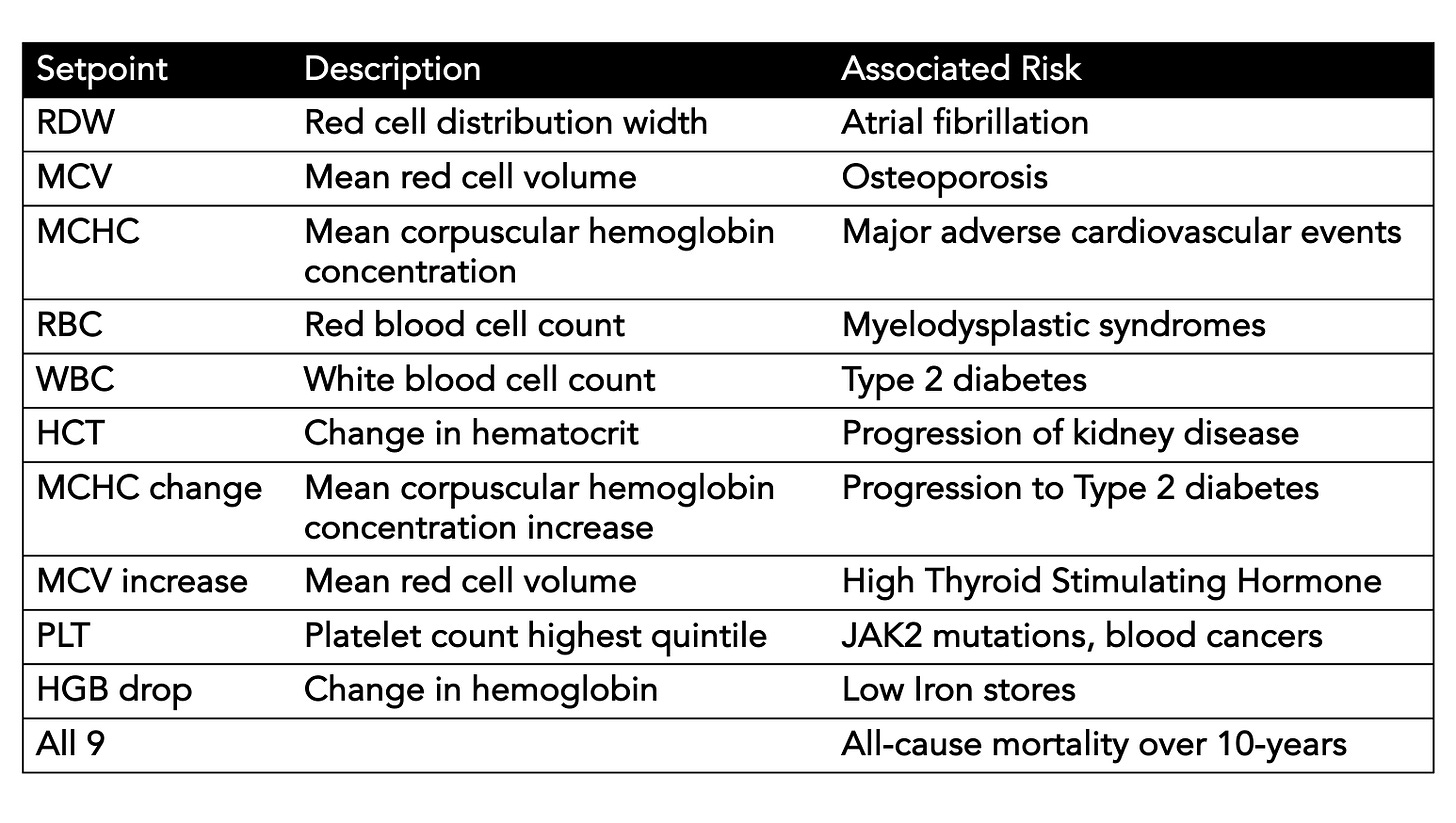
Beyond conveying risk of all-cause mortality, many of the setpoints showed association with diseases, such as the red cell distribution width (RDW) and atrial fibrillation, hematocrit (HCT) and chronic kidney disease, the white blood cell count (WBC) and Type 2 diabetes, the mean corpuscular hemoglobin concentration (MCHC) and major adverse cardiovascular events, the red blood dell count (RBC) and myelodysplastic syndrome (MDS), and the mean corpuscular volume (MCV) and osteoporosis. Again there was consistency in direction and magnitude of hazard (up or down) for most of these associations between the 2 cohorts.
Enhanced Diagnoses and Prognosis
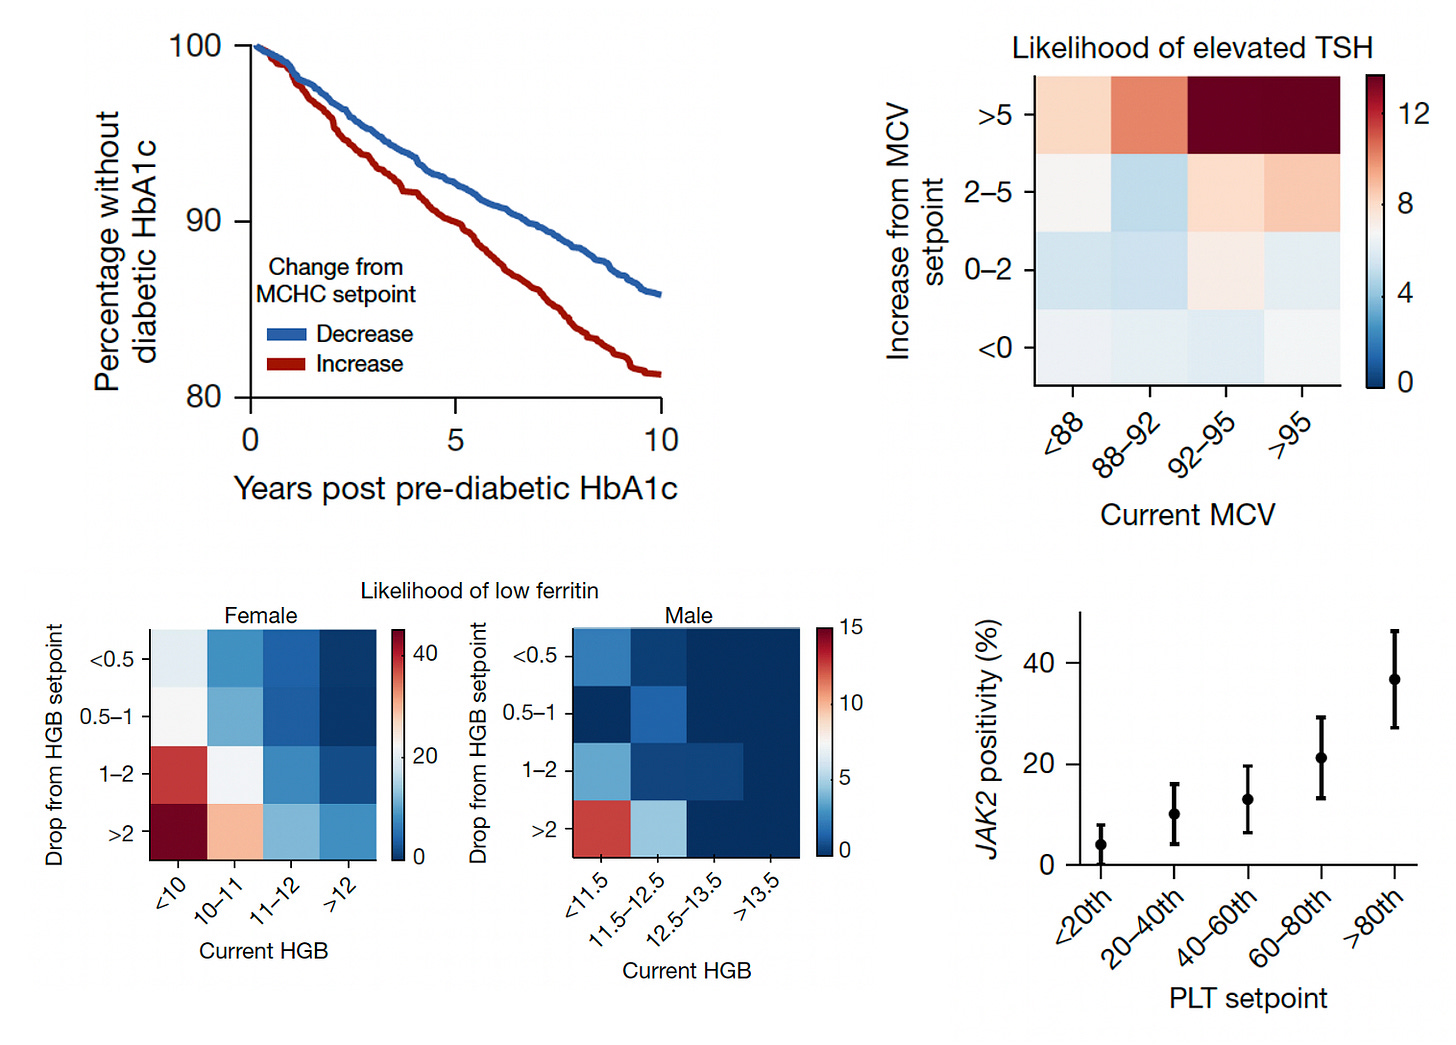
The next level of risk findings pertained to providing insights about many conditions that we don’t necessarily connect with CBC metrics (Figure below, 4 panels described sequentially). This enabled the ability to differentiate increased risk of progression to Type 2 diabetes in people as a function of MCHC setpoint, likelihood of hypothyroid status (elevated thyroid stimulating hormone (TSH) from the current MCV, low iron storage (ferritin) from the drop in hemoglobin, and even a mutation in Janus Kinase (JAK2) in people with high platelet setpoints (>9-fold higher rate of mutations, which are associated with several blood cancers.)
A summary Table I made for the many outputs we are missing from the CBC without using an individual’s setpoints
The Implications
There are so many points to glean from this instructive report. Just like opportunistic machine eyes, whereby A.I. can “see” things on a medical scan that human experts can’t (I wrote about it here and here), individualized reference intervals or setpoints provide lots of information that we’re leaving on the table, not harvesting to help inform and manage patients. So lab tests, at least the one most commonly performed, are like scans in this way. There is no reason to think that nearly all lab tests would have setpoints like our electrolytes, liver function tests, kidney function tests, lipid panels, and on and on. But they have not been explored yet like CBC s in the current study. They need to be.
Importantly, A.I. hasn’t been applied in the current study to interrogate a person’s setpoints, which would be the ideal way to determine whether any fluctuations in the individual reference range was meaningful. Clinicians and patients don’t necessarily have the time or expertise to identify subtle but key trends within the individual’s setpoint. We’ve already seen in studies of pancreatic cancer that an individual’s lab tests trends, such as bilirubin, even in the normal range, may be indicative of a higher risk, and that’s for a diagnosis that’s rarely made in the early stages.
Just thinking of the 500 million CBCs done each year in this country, and how many each of us have had over the years (many more than 5), thereby making the person’s setpoint determination all the more useful, how much of a treasure chest of “free” information that is being left behind every day.
For all the talk of “personalized medicine” over the last two decades, potentiated by the human genome sequence, this enriched interpretation of one’s lab test would be simple to implement with further validation and the right computing platform, ideally using multimodal A.I that integrates the electronic record, labs, scans, and rest of a person’s many layers of data (for more on that see this piece or this one).
If we’re ever going to step up our efforts of primary prevention for diseases, we need better means of identifying high-risk people. With lab tests, the CBC setpoints represent the beginning of a new front of rich diagnostic and prognostic information that we will hopefully integrate for routine assessment in the future.
************************************************
Thanks for reading and subscribing to Ground Truths.
If you found this interesting please share it!
That makes the work involved in putting these together especially worthwhile.
All content on Ground Truths—its newsletters, analyses, and podcasts, are free, open-access.
Paid subscriptions are voluntary and all proceeds from them go to support Scripps Research. They do allow for posting comments and questions, which I do my best to respond to. Many thanks to those who have contributed—they have greatly helped fund our summer internship programs for the past two years.


Fascinating study. To be useful in primary care discussions, these associations would be best reported as absolute and relative risks, and further explored with millions of patients before necessarily "trusting" the results reported in this paper. However, from my own "deep learning" I do find that patients' RBC indices are usually quite stable and personally unique over the years/now decades seeing them reported. I usually don't find much additional value from them unless associated with anemia, smoking, metabolic syndrome/inflammation, B12 deficiency, infection, etc. I hope this gets fleshed out and becomes more robust, thanks for sharing.
Do you have any intuitive favorite indices in cardiology considerations? Platelets as APRs come to mind...
One thing that I don't understand, and I cannot find the answer - does the direction of the move matter as much as just moving outside of the setpoint?